How I Vibe Coded hwinfo-tui in Under a Day
I vibe coded hwinfo-tui and had it published on PyPI and WinGet in under a day. The implementation itself, giving Claude the spec and getting a working app, took maybe 20 minutes. What enabled shipping that fast wasn’t the AI, it was the hours I spent on research and specification beforehand.
Everyone knows vibe coding is fast. The interesting part is what makes the output production-ready instead of a demo that falls apart.
TL;DR
- Prep work enables production quality. The vibe coding was fast because the research and spec were thorough. Skip the specification and you get code that works for the demo but breaks in production.
- Research is underrated. I spent more time researching than implementing. Reading docs, studying successful implementations, understanding how tools work.
- Specs should include architecture, not just features. This is where your judgment comes in. You’re making the important decisions based on your experience and knowledge, then telling the AI what you’ve decided. “Build a terminal hardware monitor” gets mediocre code. A detailed spec with library choices and edge cases gets production code on the first try.
- The “one shot” only works with context. Vibe coding without a spec is just iterating on bad architecture.
The Problem
HWInfo64 shows the current value of each sensor, that’s it. You can see your CPU is at 75°C right now but you can’t see if it’s been climbing for the last 10 minutes or if it just spiked. When I’m troubleshooting thermal issues or testing a new fan curve, I need to see trends over time, not just snapshots.
HWInfo64 can export sensor data to a CSV file that updates in real time. So I wanted something that could watch that CSV and plot the values live, let me see the actual behavior over time instead of staring at numbers hoping to catch patterns.
I’d seen gping’s elegant terminal UI for network latency and wanted something similar for hardware monitoring, dual Y-axes for different sensor units, fuzzy matching to find sensors quickly, the whole experience.
The Process
1. Research
This is where most vibe coding projects skip ahead and pay for it later. I spent hours reading documentation, discovering tools, understanding how they work, looking at successful implementations. Asked GitHub Copilot about architectural patterns for terminal UIs in Python, plotting libraries, CSV monitoring patterns, real-time update strategies, all discovery, no code yet.
I read through gping’s source to understand how it handled multi-line charts. Explored Plotext’s documentation to see what it could actually do with braille characters. Checked Rich’s live display capabilities for smooth terminal updates. Looked at Typer for CLI patterns.
The research gave me confidence in the stack: Plotext for ASCII charts, Rich for terminal UI, Typer for CLI, Watchdog for file monitoring. All mature libraries with good APIs and active maintenance.
2. Specification
I wrote a comprehensive spec document (specs/v1.md) collaboratively with GitHub Copilot. This wasn’t just a feature list, it was architecture decisions and implementation details:
- Features: CLI interface with
hwinfo-tui sensors.csv sensor1 sensor2, unit filtering (max 2 distinct units) - Architecture: Plotext for terminal plotting with braille characters, Rich for live display updates, Typer for CLI framework, circular buffers for memory efficiency
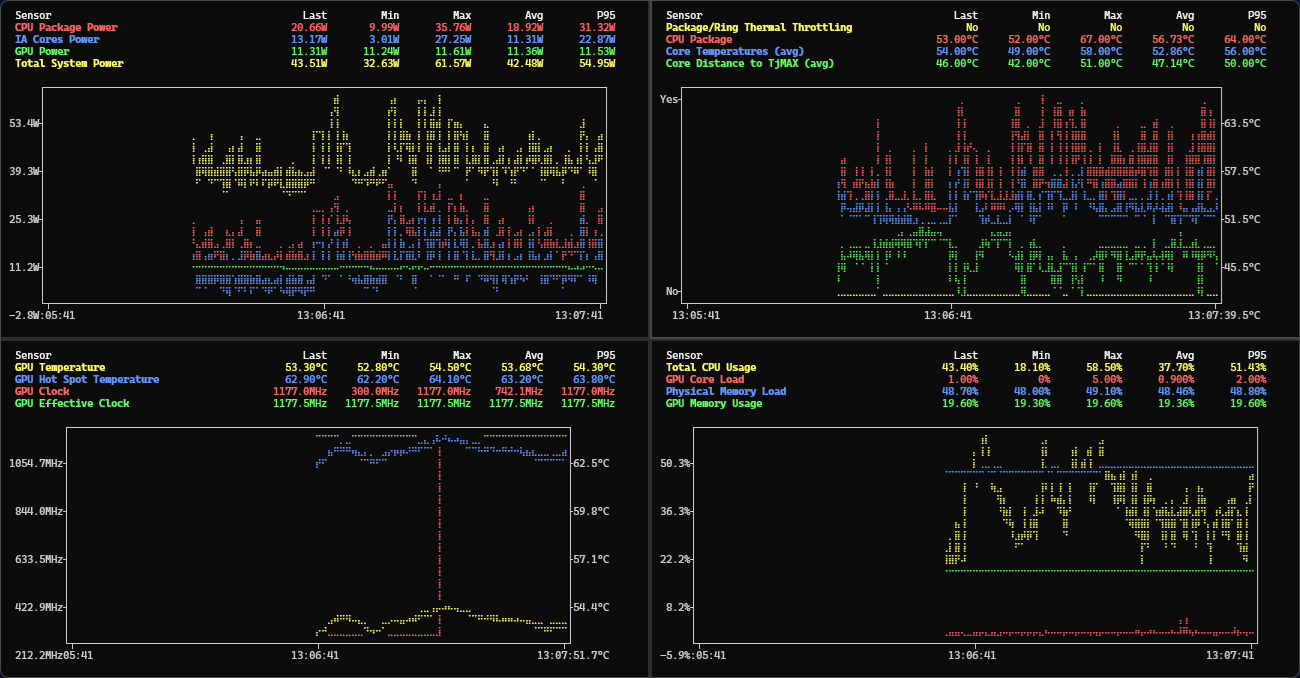
- UI layout: gping-inspired design with statistics table at top (Last, Min, Max, Avg, P95 columns) and main chart below with dual Y-axes
- Performance targets: <50MB memory baseline, <2% CPU overhead, <2 second startup, <100ms display refresh
- Error handling: Graceful degradation, automatic CSV reconnection, sensor disconnect recovery, helpful error messages
This took several hours of back-and-forth refinement. At the end I had a complete specification with zero implementation code, defining exactly what the tool should do, how it should handle edge cases, what the CLI interface should look like, how the charting should work.
3. Planning
Gave the spec to Claude and asked it to plan the implementation before writing any code. It decided on the file structure, module boundaries, class hierarchy, which functions go where. This took maybe 5 minutes, the spec had enough detail that the planning was straightforward.
4. Implementation
One shot. Gave Claude the spec and the plan, asked it to implement everything. Claude generated a fully functional application, CLI interface, real-time CSV monitoring with file watching, terminal UI rendering, interactive charts with Plotext, fuzzy sensor matching, dual-axis support, error handling, all working on the first try.
This is the part that feels like magic but only works because the spec was detailed enough. Claude had all the context it needed, what libraries to use, what the UI should look like, what edge cases to handle.
5. Polish
The implementation worked and had tests, so this wasn’t debugging. Polish was about running it and deciding if I liked what I saw. Spacing between columns in the stats table, colors for the chart lines, how the legends looked, details that only matter once you’re staring at the actual output.
I’d run the app, see something that felt off, describe what I wanted different, Claude would tweak it until it felt right. This is the part that actually matters for a product, whether you use it and like it.
6. Ship
Wrote a packaging spec and had Claude implement CI/CD. GitHub Actions workflows for automated testing, PyPI publishing on release, Windows executable generation via PyInstaller, WinGet package manifests.
Publishing to WinGet was interesting because the portable app upgrade path has quirks (probably another blog post), but the automation worked.
What Got Built
The final tool has:
- Real-time CSV monitoring - Watches HWInfo64’s CSV export and updates automatically
- Interactive terminal charts - ASCII plots using Plotext with smooth updates
- Dual Y-axes - Different units (°C, RPM, %) on separate axes
- Fuzzy sensor matching - Type partial names and it finds the right sensors
- Rich statistics - Min, max, average values alongside the charts
Install with pip install hwinfo-tui or winget install hwinfo-tui.
The Tech Stack
- Python 3.8+
- Rich for terminal UI
- Plotext for ASCII charts
- Typer for CLI
- Pandas for CSV handling
- Watchdog for file monitoring
- PyInstaller for Windows executables
Using It
Install with pip install hwinfo-tui or winget install hwinfo-tui.
Point it at HWInfo64’s CSV export and specify sensors to watch:
hwinfo-tui path/to/sensors.csv "CPU Package" "GPU Temperature"
The tool watches the CSV, plots the values in real time, handles different units on separate Y-axes, and shows statistics. Press Ctrl+C to exit.
Open Source
The code is on GitHub. If you use HWInfo64 and want terminal-based monitoring, grab it and see if it’s useful.