Introducing ccburn: A Visual Way to Track Your Claude Code Token Burn

I was deep in a Claude Code session, shipping features, everything clicking, when it just stopped. I had ran out of tokens with two hours left in my window, creative momentum gone. When I came back after the cooldown it wasn’t the same. Have you felt that?
The /usage command exists but I wasn’t invoking it regularly. The website shows your percentage but not your pace. I kept doing mental math on whether “47% with 2.3 hours left” was sustainable, and I kept getting it wrong.
The Token Economy Got Real
2025 was wild for Claude Code users. Anthropic introduced weekly limits on top of the 5-hour rolling windows. Infrastructure bugs degraded quality for weeks, a holiday bonus doubled limits in December and made January feel like a reduction when it ended. The community was confused about what was happening to their token budgets.
Then tools like Ralph Wiggum and Gas Town showed up. Ralph Wiggum runs autonomous loops where Claude keeps iterating on a task until it’s done, the prompt never changes but the codebase does. A 50-iteration loop can burn $50-100 in API credits. Gas Town lets you manage 20-30 parallel agents via tmux, some power users are spending $60k/year on tokens.
These tools enable insane productivity but they burn tokens fast. Y Combinator teams shipped 6+ repos overnight for $297 in API costs. One developer completed a $50,000 contract for under $300 in tokens. The economics work if you can see what you’re spending.
I Wanted a Burn-Up Chart
I’ve spent years working in sprints reading burn-up charts, my brain just gets them at a glance. A line going up, a budget pace line showing where you should be, instantly know if you’re ahead or behind without doing mental math.
ccusage is great for cost and token tables but it’s TypeScript/Node and there’s no good terminal plotting library in that stack. I wanted charts. Python has Plotext, so I built ccburn with the same stack as my hwinfo-tui project: Rich for the interface, Plotext for charts, Typer for the CLI.
What ccburn Does
Real-time burn-up charts for Claude Code usage limits. Session (5-hour rolling), Weekly, and Weekly-Sonnet limits each get their own visualization.
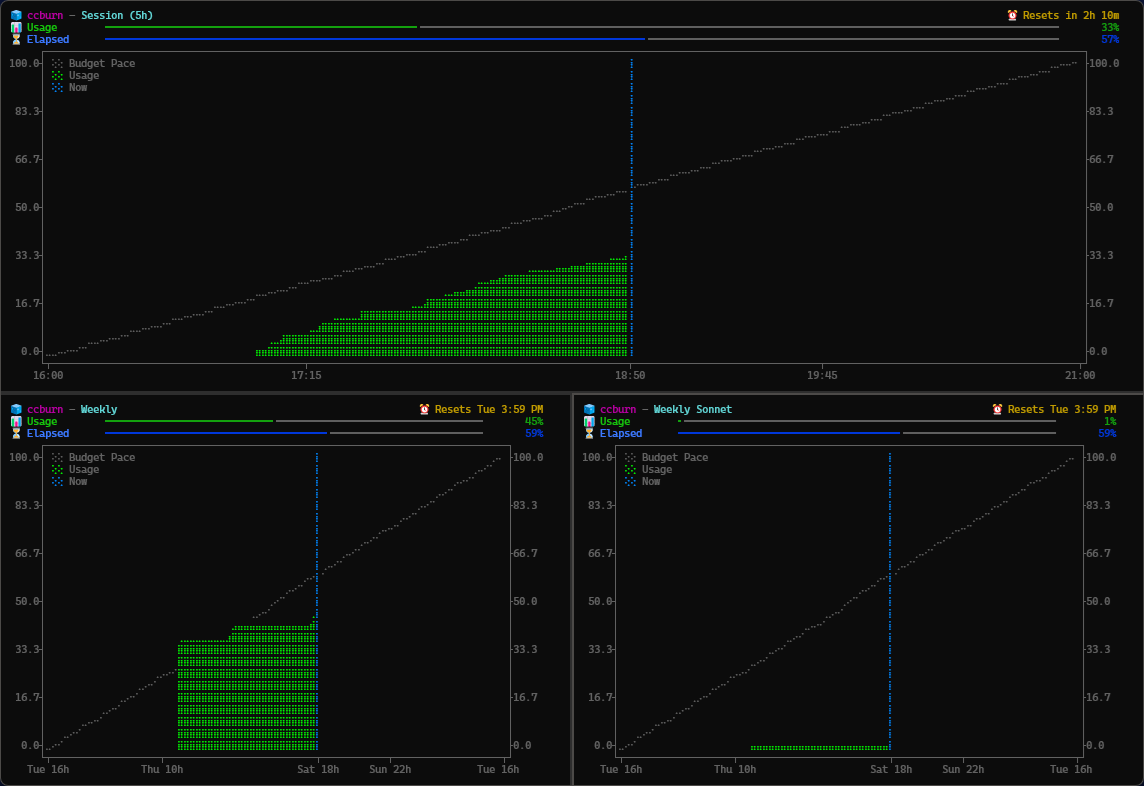
The chart shows your actual usage climbing against a budget pace line, where you “should” be if you consumed tokens linearly across the window. Instantly see if you’re:
- 🧊 Behind pace (headroom, you’re fine)
- 🔥 On pace (tracking budget)
- 🚨 Burning too hot (slow down)
Compact mode is where this gets useful:
ccburn --compact
# Output: Session: 🔥 45% (2h14m) | Weekly: 🧊 12% | Sonnet: 🧊 3%
Throw that in your tmux status bar and glance at it without leaving your editor.
Installation
Run claude first to refresh credentials, then:
# WinGet (coming soon)
winget install JuanjoFuchs.ccburn

# npx (no install)
npx ccburn

# npm global
npm install -g ccburn

# pip
pip install ccburn
Usage
ccburn              # Session limit TUI (default)
ccburn weekly       # Weekly limit
ccburn weekly-sonnet # Weekly Sonnet limit
ccburn --compact    # Single line for status bars
ccburn --json       # JSON output for scripting or usage by claude itself
ccburn --since 30m  # Zoom to last 30 minutes
The Meta Part
Built ccburn in a few sessions over the weekend with Claude Code, using ccburn to monitor the token spend while building ccburn. Pretty meta actually.
Seeing the burn is step one. Doing something about it is step two, and I keep a living guide of 14 habits for using Claude Code without wasting tokens, each one cited rather than vibes.
Check it out on GitHub and PyPI. Would love feedback on features or bugs.