Claude Code Made Me Change My Laptop's Thermal Paste
More like convinced me, actually.
I had been dealing with thermal throttling on my Dell Precision 5570 for over two years. CPU would hit really high temperatures under moderate load and throttle constantly, the laptop was unusable at times. Folks suggested opening it up and changing the thermal paste but I’d never done that before, so I didn’t want to risk it.
Tried the usual fixes: cooling stand, cleaned the fans, adjusted power profiles. Nothing helped. Then I pasted temperature chart screenshots to Claude Code and it diagnosed the problem in one shot. The thermal paste had failed, and the clue was hiding in plain sight. But more importantly, Claude explained what was happening so clearly that it finally convinced me to open the laptop and change the paste myself.
Building hwinfo-tui
As a good engineer, instead of directly fixing the issue, I first built a tool!
I needed to see temperature trends, not just current values. HWInfo64 is great at collecting sensor data but its UI shows you the current reading, maybe min/max/avg. That’s not enough when you’re trying to understand what happens over time during a throttling event.
HWInfo64 has some graphical plotting options but the UI looked outdated and I was already spending most of my time in the Terminal with Claude Code, so I wanted something that would plot there. Nothing existed.
So I built hwinfo-tui, a terminal tool that watches HWInfo64’s CSV export and plots live charts. Dual Y-axes so you can overlay sensors with different units, see how temps changed under load, when throttling kicked in, what the relationship was between different readings.
The key insight with time graphs is that you stop focusing on the numbers and start seeing correlations. I don’t mean just spikes and valleys, I mean the gaps - the vertical space between two lines over time. If the gap between CPU core temp and package temp grows over the course of a session, that tells you something. If the gap between core temp and TjMAX shrinks, you’re watching the CPU approach its throttle point. You can see all of this without reading a single number, the visual patterns tell the story.
Feeding Charts to Claude
I remembered reading that multimodal models understand time-series data better when you show them plots instead of raw numbers. So I tried an experiment.
I asked Claude Code to use hwinfo-tui to list all available sensors, then gave me commands to generate different charts. I ran those commands, took screenshots of the charts showing various combinations of sensors - core temps, package temp, power consumption, throttling status - and pasted them all into Claude Code.
This is the part that surprised me. I’d been staring at these numbers for months. I knew the temps were high, I knew the throttling was constant, but I couldn’t connect the dots to a root cause. Claude looked at the same charts and immediately saw the pattern I’d been missing.
I could have had Claude write Python scripts to analyze the CSV with Pandas, compute correlations, find anomalies. That probably would have worked too, but it would have taken more turns, more tokens, more back-and-forth. With screenshots, Claude diagnosed the issue and gave me a clear answer in one shot.
What Claude Found
Claude pointed out something I’d completely missed. Here’s how it explained it:
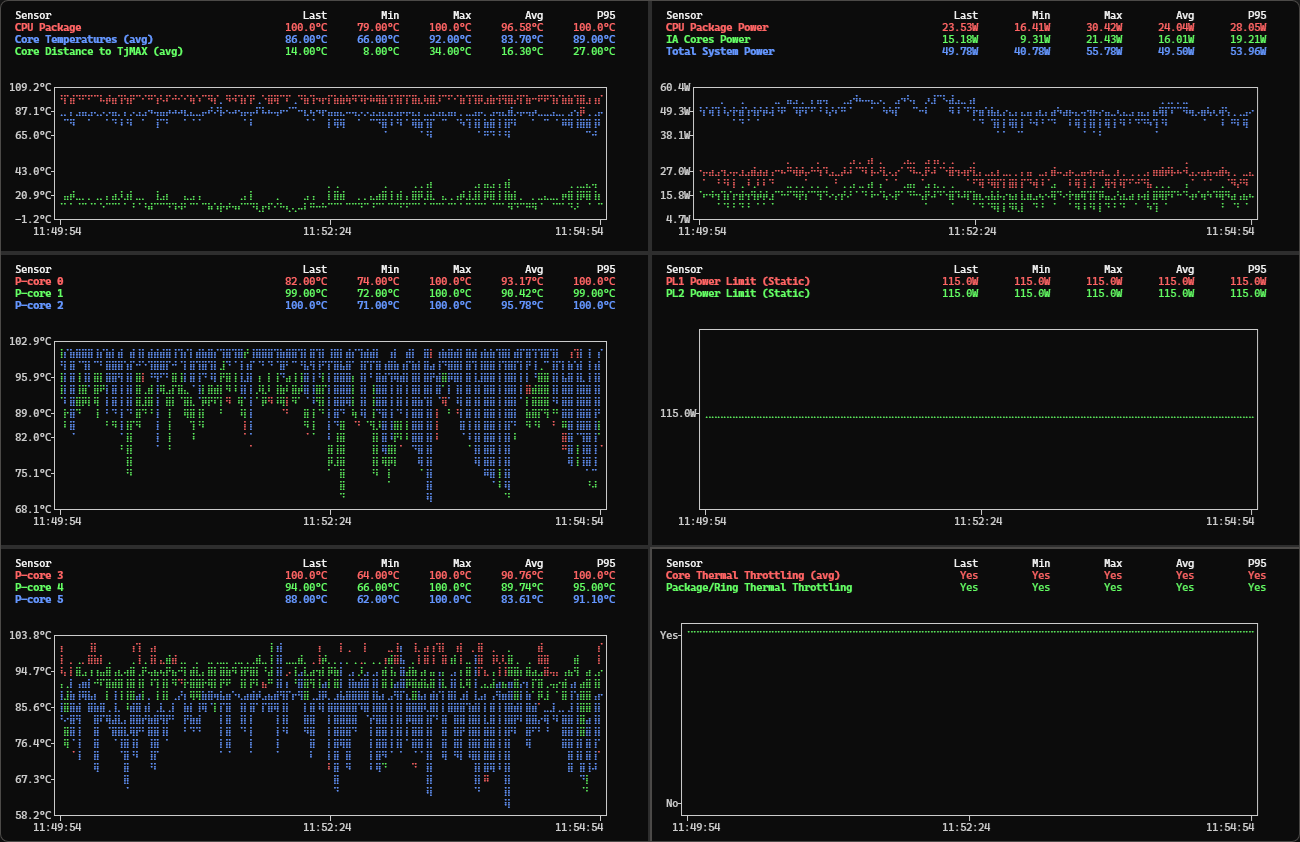
Look at the gap between the CPU Package line and the Core Temperatures line in your charts. In a healthy system, those two lines should track close together - maybe 5-10°C apart. In your charts, there’s a consistent 13-23°C gap between them.
That gap is the problem. The CPU throttling system responds to package temperature, not core temperature. When the package runs that much hotter than the cores, it means heat isn’t transferring efficiently from the CPU die to the heatsink. The thermal interface has degraded.
The combination of that large gap, low power consumption (50% of limit), and constant throttling is a strong diagnostic signature of thermal contact failure.
Main culprit: dried/degraded thermal paste - most common on laptops 2+ years old. Repaste the CPU with quality thermal compound.
I didn’t know any of this before. Reading the gap between two lines on a chart as a diagnostic for heat dissipation - that was new to me, and it made everything click.
The Fix
Claude’s recommendation was clear: repaste the CPU. The thermal interface had failed.
So I did. I’d never done this before, but Claude’s explanation of what was happening made me confident enough to try. I cleaned the old paste and used a PTM7950 phase change thermal pad instead of regular paste - it’s easier to apply (especially if you cool it in the fridge first), lasts longer, and performs better than traditional compounds.
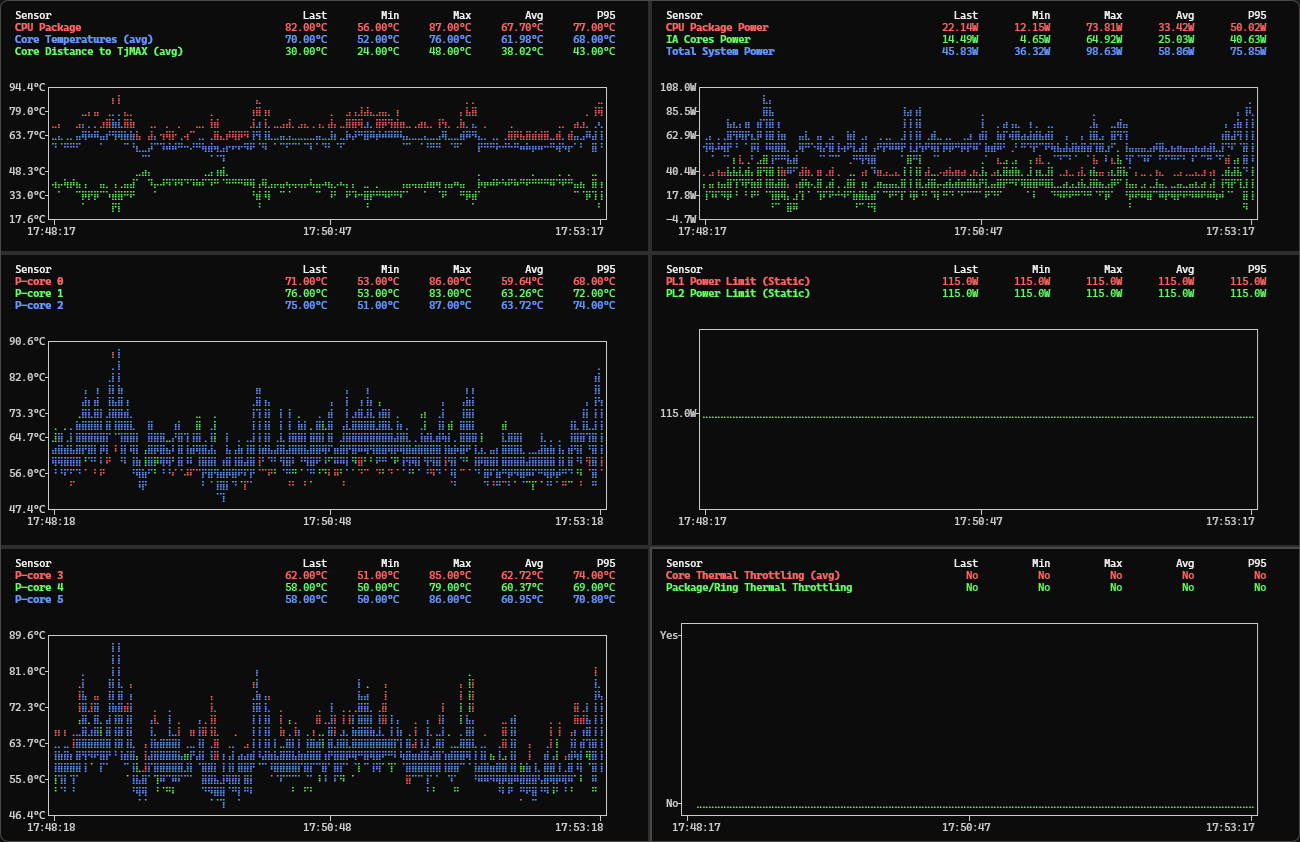
Package temp dropped from 97°C to 68°C. Throttling events went from constant to non-existent. Two years of problems, fixed in an afternoon.
What I Learned
-
Thermal paste should be changed every 2 years.
-
Give the AI enough context and it can explain things you couldn’t figure out yourself. I’d been staring at these numbers for months without connecting the dots. Once Claude could see the full picture, it explained the problem clearly enough that I finally felt confident to act. Two years of hesitation, solved by a clear explanation.