claudefana: Beyond the Burn Rate
I’ve been using ccburn for the past few months, always open on my side screen so I can monitor my burn rate, projection, and depletion dates. I could see at a glance whether I was burning too fast or had headroom. I wrote about it in Introducing ccburn and then covered strategy in How to Maximize Your Claude Code Pro/Max Plan.
But spend is one number. After the initial “am I going to run out?” anxiety faded, I started wanting different things: cost per commit, cache effectiveness, lines of code per dollar, breakdowns of expensive sessions.
Claude Code already tracks all of this but doesn’t surface it anywhere.
Claude Code’s Hidden Telemetry
Claude Code has built-in OpenTelemetry support. Add a few environment variables to your settings and it starts exporting metrics and structured log events every few seconds.
The native metrics cover cost per session, token counts by type, active time, session counts, lines added/removed, and edit accept/reject decisions.
Every API request, every tool call, every edit decision gets exported as a structured event with attributes like model, duration, cost, token breakdown, and tool name. An OpenTelemetry Collector can convert those events into metrics automatically — counting tool calls by name, extracting cost per request, computing token breakdowns per model. Raw events become dashboard panels without writing any code.
Anthropic documents all the available signals in their monitoring usage guide. I couldn’t find a simple dashboard to visualize it all.
Setting It Up
Setup is three steps and takes a few minutes.
Step 1: Tell Claude Code to export telemetry. Add this to your ~/.claude/settings.json:
{
  "env": {
    "CLAUDE_CODE_ENABLE_TELEMETRY": "1",
    "OTEL_METRICS_EXPORTER": "otlp",
    "OTEL_LOGS_EXPORTER": "otlp",
    "OTEL_EXPORTER_OTLP_ENDPOINT": "http://localhost:4317"
  }
}
Step 2: Clone and start claudefana.
git clone https://github.com/JuanjoFuchs/claudefana.git
cd claudefana
docker compose -f docker-compose.otel.yaml up -d
That starts four services: an OpenTelemetry Collector, Prometheus for metrics, Loki for logs, and Grafana with a pre-built 26-panel dashboard.
Step 3: Start Claude Code and open http://localhost:3000.
The dashboard starts populating as you work. You don’t need to configure anything, set up a database, or build panels. The services auto-start with Docker so you don’t have to remember starting it up every time.
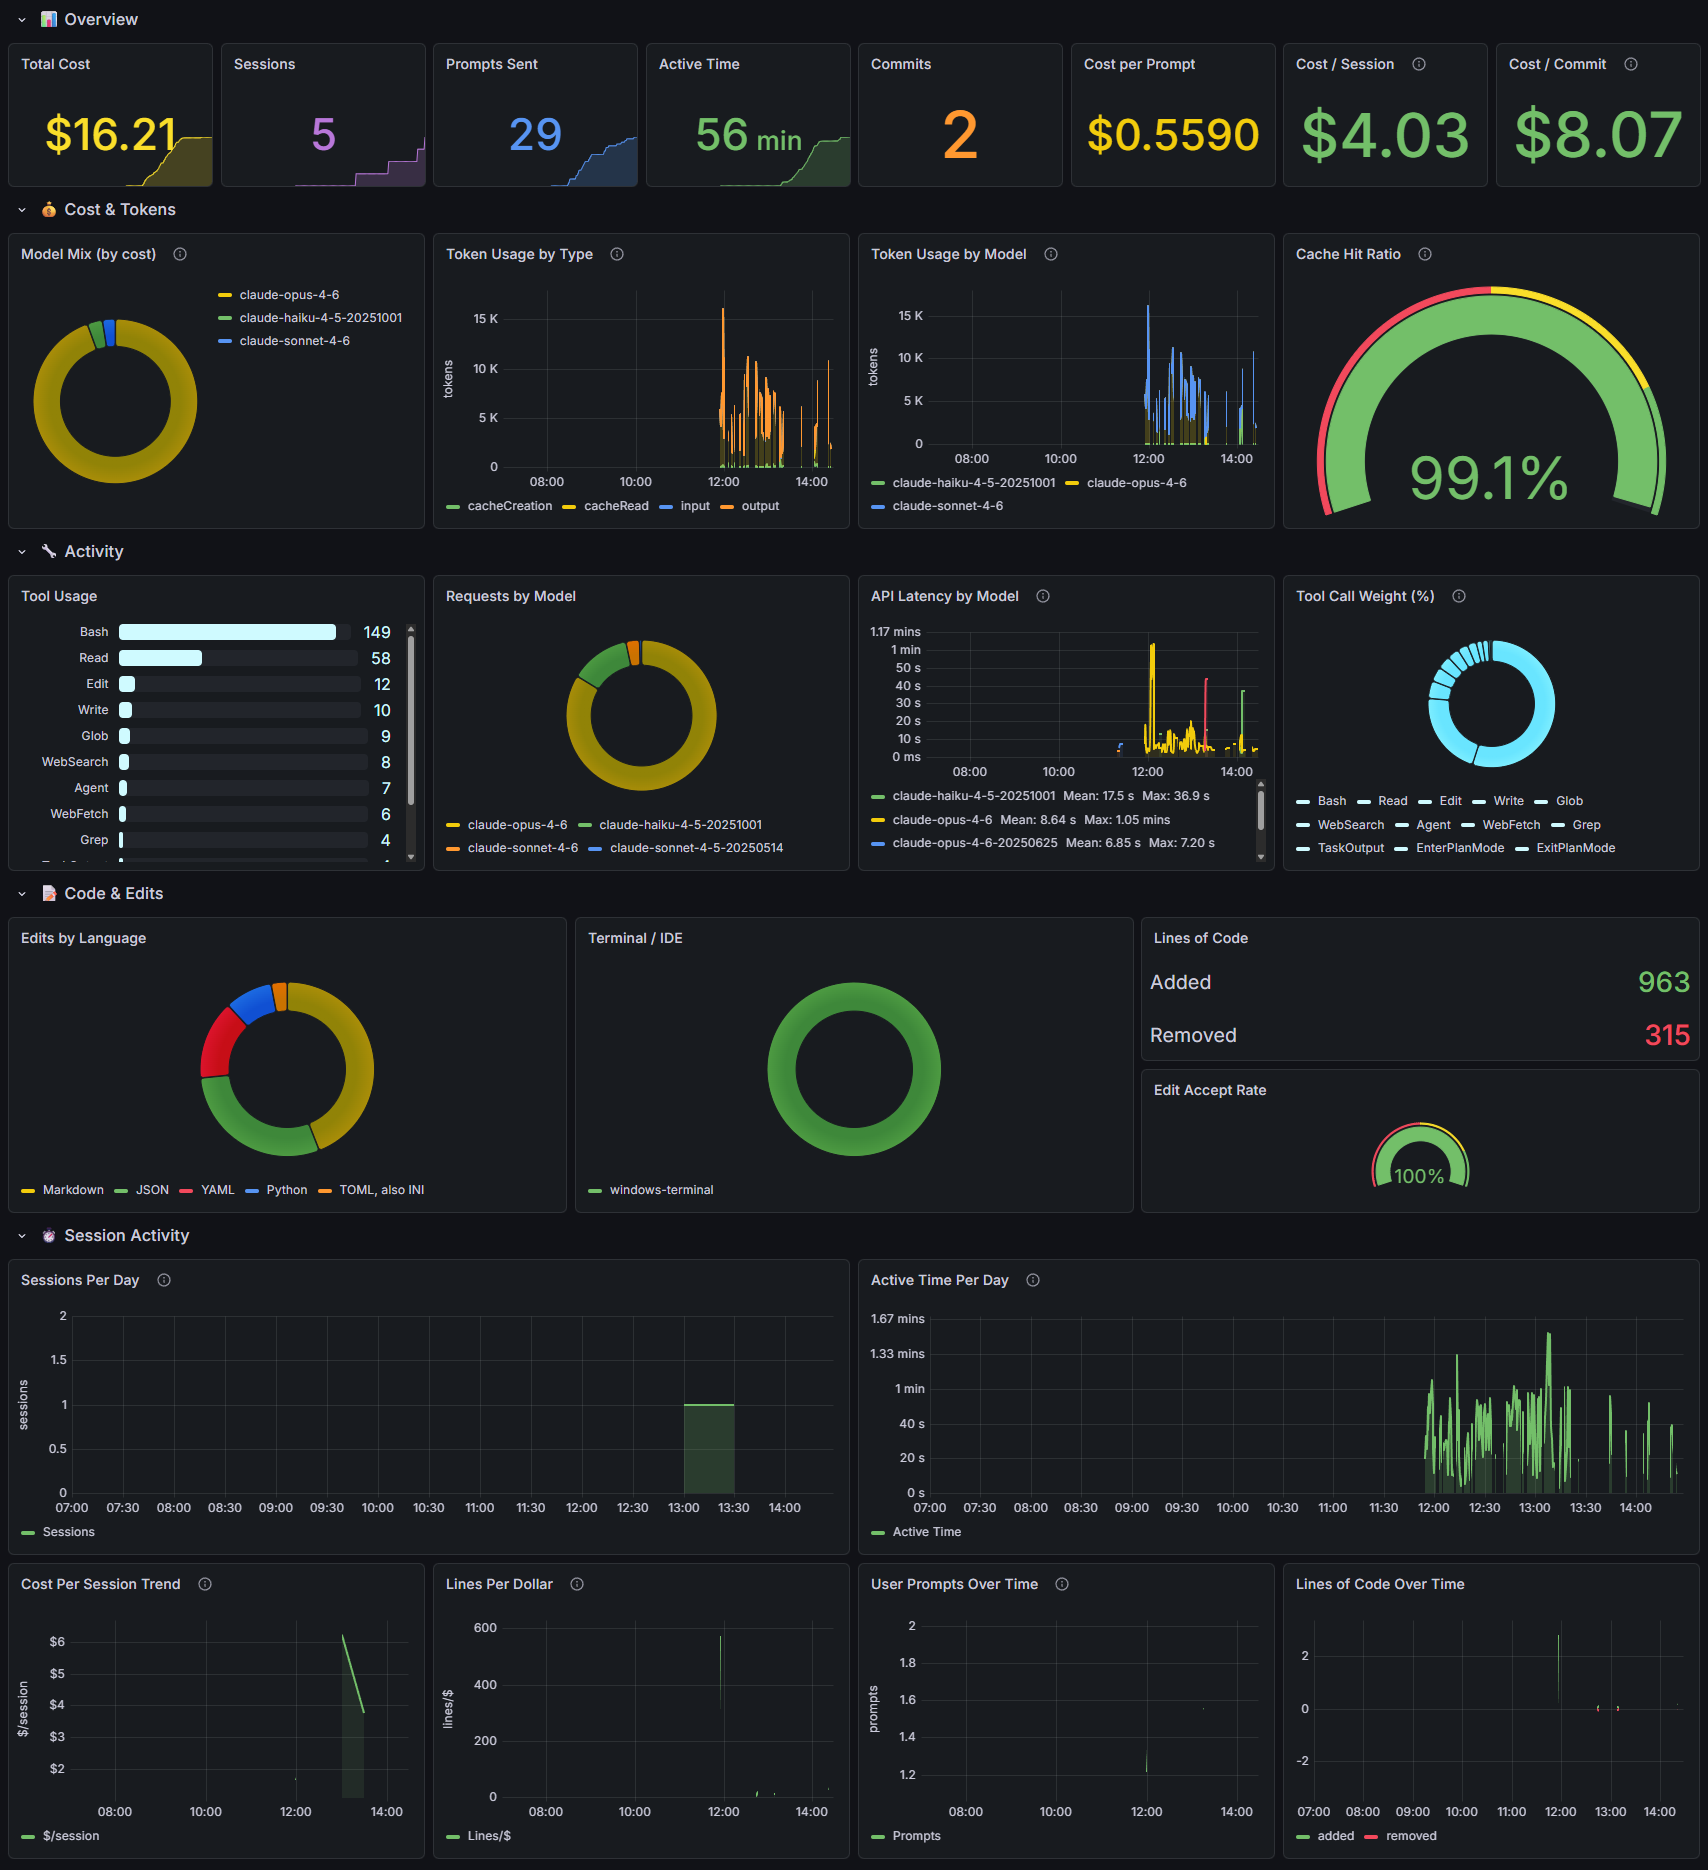
What the Dashboard Shows
26 panels across 8 sections, the README has the full breakdown. A few panels changed how I think about my usage:
Cache Hit Ratio
The gauge in the screenshot reads 99.1%. That’s great, it means almost every token Claude reads is coming from cache instead of being re-processed from scratch. Cache reads are significantly cheaper than fresh input tokens.
This number tanks when I switch branches or start a new conversation. The cache is tied to the context, so every branch switch or /clear effectively resets it. Those moments correlate directly with cost spikes in the session timeline. Now I’m more intentional about when I switch context, I keep one feature or unit of work within a single conversation and /clear between them. /compact sounds like it would help but it sometimes causes Claude to forget things, so I’d rather take the cache hit and start fresh with full context. That’s more context engineering than cost optimization, but I only noticed after seeing the cost spikes on the session timeline.
Cost per Commit
Some sessions produce commits at $2 each, others at $15. The expensive sessions are usually exploratory work where I’m figuring out an approach before committing to it. The cheap sessions are when I know exactly what I want and Claude is just executing.
Seeing this number made me realize that the exploration phase is where most of my spend goes, not the implementation. That’s fine, it’s the right use of the tool. I just hadn’t quantified it before.
Lines per Dollar
This one trends over time. When the line goes up I’m getting more output per dollar. When it drops I’m doing research, architecture, debugging, work that doesn’t produce lines of code but is still valuable.
The pattern I noticed: lines per dollar spikes on days when I’m doing mechanical work (migrations, refactors, applying a pattern across files) and drops on days when I’m designing something new. Seeing the trend helps me understand why some days feel expensive and others don’t.
Tool Usage
This panel counts invocations, not tokens. OpenTelemetry doesn’t expose how many tokens each tool call costs, so you can’t say “Bash costs me the most.” You can see the distribution of how Claude spends its time. Heavy Bash usage points to system work. Heavy Read with low Edit points to exploratory sessions.
Edit Accept Rate
How often I accept Claude’s suggested edits versus rejecting them. A signal of prompting quality. If I’m rejecting a lot, my instructions aren’t clear enough or I’m asking for changes I could describe better.
Gaps
I’ve filed feature requests for each of these. If any of them matter to you, go upvote or comment on the issues so Anthropic knows there’s demand.
Thinking tokens aren’t in OpenTelemetry. When Claude reasons through a problem, it generates internal tokens that can be 3-10x the visible output. These count toward your rate limits but don’t show up in any metric. The cost metrics undercount what Claude actually consumes. Feature request →
No token cost per tool. The dashboard shows how often each tool is called, but not how many tokens each invocation costs. You can’t say “Read costs me 40% of my tokens.” That data isn’t exported. Feature request →
No project or repo context. There’s no label indicating which codebase a session is working on. If you work across multiple projects you’ll see all the metrics blended together. Feature request →
Usage limits need a separate exporter. The rate limit gauges (5-hour rolling, weekly, etc.) require the included claude-usage-exporter.py which scrapes Anthropic’s usage API. This is actually how ccburn works under the hood, the exporter reuses the same approach. It’s optional and works on Linux and Windows out of the box. macOS needs a small extra step since Claude Code stores credentials in Keychain instead of a file, the README has the details.
Try It
claudefana is open source: github.com/JuanjoFuchs/claudefana. The README covers setup, the full panel list, alert rules, and configuration options.
If you’re just looking for token pacing without the full dashboard, ccburn is the simpler tool: Run npx ccburn and you’re watching your burn rate.