How to Maximize Your Claude Code Pro/Max Plan in 2026 (Limits, Tokens, and Getting Your Money's Worth)
You got a Claude Code subscription. You’ve heard people ship entire projects overnight with it. Maybe you’ve seen the screenshots of Gas Town running 20 parallel agents or Ralph Wiggum loops burning through tasks at incredible speed.
This guide is about getting your money’s worth from your subscription. I’ll cover three stages: understanding what you have, using more of it, and not running out mid-session. If you’d rather jump straight to concrete habits, I keep a living guide of 14 of them, each one cited to Anthropic’s docs or a published field heuristic, and I update it as the tooling changes.
Understanding What You Have
The Token Economy
January 2026 was confusing for Claude Code users. Anthropic ran a holiday bonus that doubled limits, then returned to normal. Forums filled with complaints about “reduced limits” when really the baseline just felt smaller after the bonus ended.
The token economy has two layers: 5-hour rolling windows and weekly limits. Your session window starts when you send your first message and resets 5 hours later. Weekly limits cap your total usage across all sessions, with separate buckets for different models.
Know Your Models
Opus burns allocation roughly 5x faster than Sonnet. Same prompt, same task, very different token cost. Haiku is cheaper still, about 1/3 of Sonnet’s cost while matching its coding performance for straightforward tasks.
When to use each:
- Opus: Complex reasoning, architectural decisions, tasks where you need the best output on the first try
- Sonnet: Default for most coding work, good balance of capability and cost
- Haiku: Exploration, summarization, research tasks, anything read-only
The model you pick matters more than how many prompts you send. A session of heavy Opus usage will hit limits faster than twice as many Sonnet prompts.
Your Token Scorecard
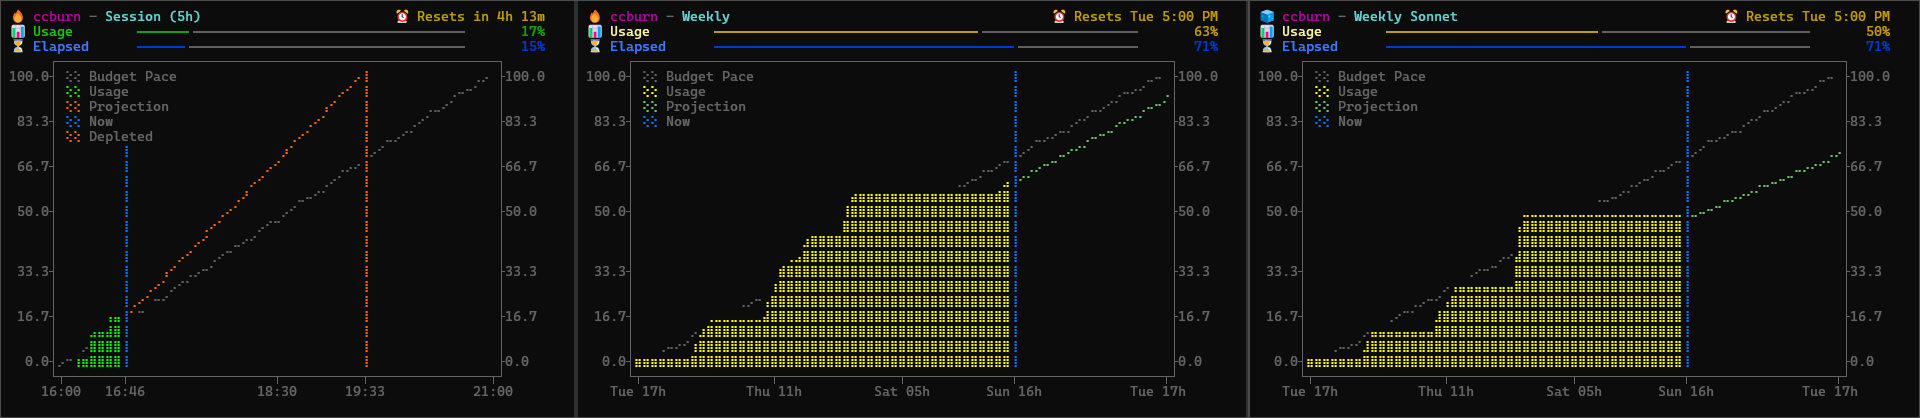
I built ccburn to see token consumption at a glance (full backstory in my previous post). The screenshot above shows the three panels: Session (5-hour rolling window), Weekly, and Weekly Sonnet.
Each chart shows your actual usage climbing up, with a budget pace line (dotted) showing where you’d be if you consumed tokens linearly across the window. A blue “Now” marker shows the current point in time. The usage line changes color based on your status: green when below budget pace, yellow when tracking budget, red when above.
The charts also show a projection line based on your current burn rate. The projection is green when you’re on track to stay under budget, and turns orange/red when you’re burning too fast. If the projection shows you’ll hit 100% before the window resets, a red “Depleted” line appears marking exactly when you’ll run out. In the screenshot, the session chart shows 17% usage but a steep projection that would deplete around 19:33 if the current pace continues.
Compact mode gives you a single line for your tmux status bar or Claude Code’s status line:
ccburn --compact
# Output: Session: 🔥 16% (4h 20m) | Weekly: 🔥 63% | Sonnet: 🧊 50%
The icons tell you your status: 🧊 means you’re behind pace (headroom), 🔥 means you’re tracking budget, 🚨 means you’re burning too hot.
You can also give Claude Code awareness of its own consumption by having it call ccburn --json. The output includes utilization percentages, burn rate per hour, time until limits reset, and a projection showing if and when you’ll hit 100%. Claude can call this periodically to check where the projection is heading, then suggest starting a fresh conversation or switching to a cheaper model before you hit depletion.
While writing this post, I had Claude run ccburn --json and tell me how it would use the data:
How I’d Use This to Help You:
- If you asked me to do something ambitious, I’d check this first and know it’s safe to proceed
- I could suggest switching to Haiku for research tasks since you have budget to spare
- If projection showed “hits_100: true” I’d warn you before starting a large task
- I could call this periodically and suggest a fresh conversation if burn rate spikes
Meta, but exactly the kind of awareness that helps you make better decisions.
Using More of It
The Gap Problem
Open ccburn and look at your weekly-sonnet chart. See the gap between the budget pace line and your actual usage? That’s capacity you’re not using.
Most people start conservative. They use Claude Code for specific tasks, wait for it to finish, review carefully, then maybe ask a follow-up. Nothing wrong with that, but you’re leaving capacity on the table.
What to Do With Your Unused Capacity
If your weekly chart shows headroom, use it. Kim and Yegge’s Vibe Coding book calls this mindset shift FAAFO: Fast, Ambitious, Autonomous, Fun, and Optionality.
Run parallel explorations. Have Claude try two different approaches to the same problem and compare them. You’re not paying extra for the second attempt, you’re using allocation you already have.
Use AI for tasks you’d normally skip:
- That refactor you know would clean things up but isn’t urgent
- Tests for the module that’s been running untested for months
- Documentation you keep meaning to write
- Migrating from one library to another
- Processing your notes to make your second brain AI-compatible
- Vibe coding a terminal monitoring tool you’ve been wanting
- Building an MCP server for your specific workflow
- Creating custom tooling to scratch your own itch
These “nice to haves” cost nothing extra if you’re under your limits.
The goal isn’t to burn tokens for the sake of it. The goal is to do more with a tool you’re already paying for.
Not Running Out Mid-Session
The Depletion Problem
Now the opposite problem. Your ccburn chart shows a steep usage line, the projection says you’ll hit 100% before the window resets. You’re in the middle of something and you’re about to get cut off.
The cost of running out mid-session isn’t just the wait time. It’s the broken momentum. You had context loaded, you knew exactly what to do next, and now you have to stop. When you come back in a few hours, you’ll spend time rebuilding that mental state.
Session Timing
The 5-hour window starts when you send your first message. Most people start their session when they start working, which means the window runs out sometime during their workday.
Here’s what I do instead: I start a session 2-3 hours before I actually start working. Send a simple prompt at 6am, then do other things. The window runs from 6am to 11am. I start real work at 9am. At 11am, right in the middle of my focus block, the window resets and I get a fresh allocation.
The result: during my 5-hour focus block (9am-2pm), I have access to two windows’ worth of tokens. The first window covers 9am-11am, then it resets and I get another full window from 11am onward.
You’re front-loading the reset to happen when you’re already in flow, not when you’re winding down. The “interruption” of the window ending happens at 11am when you have maximum momentum to immediately start burning into the next window.
To verify your session started, run ccburn --compact before you start real work. If it shows session data, you’re good. If it doesn’t, send any prompt to kick off the window.
Model Delegation
When your charts show you’re burning too fast, the first thing to check is which model you’re using. If you’re running Opus for everything, that’s your problem.
Delegating work to Sonnet and Haiku isn’t a compromise, it’s using the right tool for the job. Haiku runs 2x faster than Sonnet at 1/3 the cost, and for many tasks the output quality is identical.
You don’t need special configuration to do this. Just tell Claude what you want. When I was researching for this post, I told Claude:
Do the web searches yourself, but launch parallel sub-agents using Haiku to read the web pages and give you summaries.
It did exactly that, running multiple Haiku agents in parallel to fetch and summarize content while the main conversation stayed focused on planning.
The pattern that works well: Sonnet or Opus for planning and orchestration, Haiku for execution and research. Let the more capable model figure out what to do, then hand off the actual work to the cheaper model with clear instructions. Haiku doesn’t need to reason much when the task is well-defined. If you’ve managed engineers before, these delegation skills transfer directly.
If you find yourself using the same delegation pattern repeatedly, you can automate it with custom sub-agents.
Pacing Techniques
Beyond model selection and timing, a few techniques help you burn tokens more efficiently.
Batch your prompts. One long request with multiple changes burns fewer tokens than sending five separate “please also fix this” follow-ups. Each round-trip has overhead, each follow-up requires Claude to reload context.
Use /compact before you hit limits. This command compresses your conversation context, reducing the tokens needed for subsequent prompts. Run it when you see your session chart climbing faster than you’d like.
Keep your AGENTS.md lean. If your project instructions file is hundreds of lines, that’s context loaded on every prompt. Keep it under 60 lines. Trust code patterns over exhaustive instructions.
Avoid the final 20% of context window. Response quality degrades as the context fills up. Don’t start a complex task when you’re already deep into a conversation. Run /compact or start fresh.
Use /clear between unrelated tasks. When you switch from debugging authentication to writing documentation, the previous context is just noise. Clear it and let Claude start fresh with only what’s relevant.
Let MCP Tool Search do its job. Claude Code now dynamically loads MCP tools on-demand instead of preloading all of them, reducing token overhead by up to 95%. It auto-enables when your tool definitions exceed 10% of context. If you have many MCP servers and notice context issues, check that you’re on Sonnet 4+ or Opus 4+ (Haiku doesn’t support tool search).
🔥ccburn: See Your Usage, Change Your Behavior
You can’t manage what you can’t measure. — Peter Drucker
ccburn gives you visual understanding. Burn-up charts show your trajectory, not just your position. Projection lines show where you’re headed. The gap between your usage and the budget pace line shows exactly how much headroom you have or how fast you’re burning through it. When you’re burning too fast, a depleted prediction shows exactly when you’ll run out, giving you time to adjust before you hit the wall.
Once you can see it, you start making different decisions. You notice the flat line and try something more ambitious. You see the steep projection and switch to Haiku. The visual feedback loop changes how you work.
Try it with npx ccburn or install with winget install ccburn. Check out the GitHub repo for more options.