Usage Is Not Value
Uber maxed out its full-year AI coding budget only a few months into 2026. The Information reported that surging Claude Code use is driving the spend, and around 11% of real backend updates at Uber are now written by AI agents.
That’s the problem the next year of AI adoption is going to live in. Companies pushed hard to get developers using Claude, Cursor, Codex, and Copilot, adoption worked, and the bill followed. Now the question is whether the spend produced anything worth paying for.
Raw token count is the easiest answer to reach for, and it’s the wrong one.
The Measurement Ladder
Usage is telemetry. It tells you something happened. It doesn’t tell you whether the work was useful, whether the model got stuck, or whether the user gamed the dashboard. It definitely doesn’t tell you whether the work moved a KPI that matters.
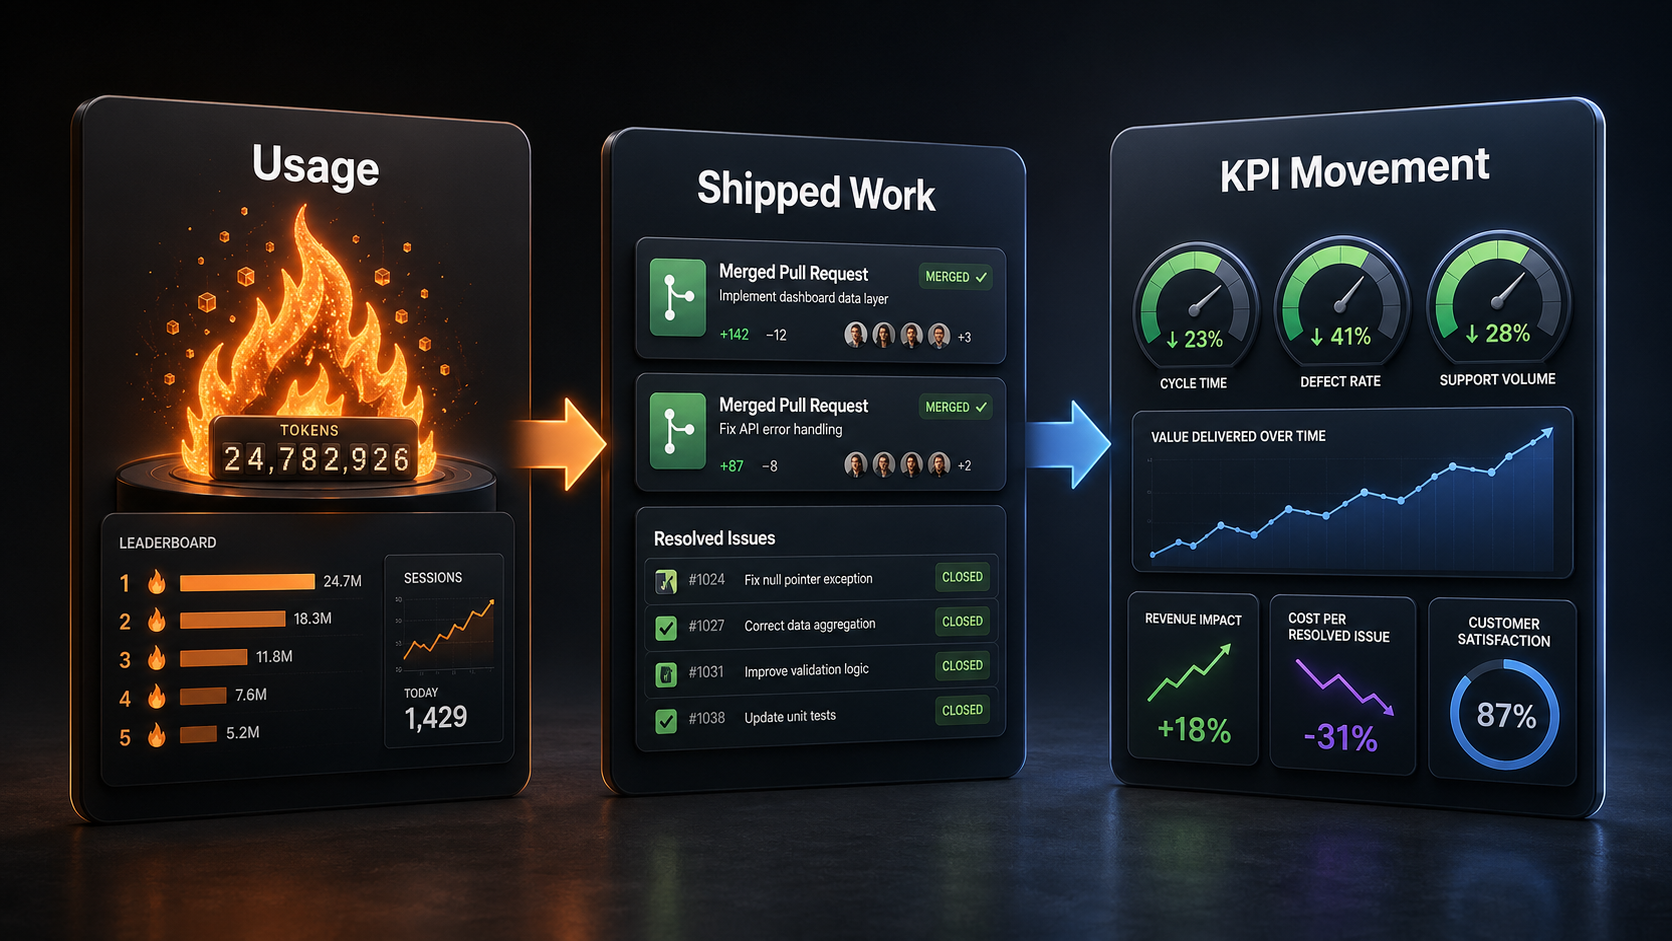
There are three layers worth measuring:
- Usage: tokens, sessions, hours of model time. The activity layer.
- Shipped work: PRs merged, defects fixed, code accepted. The output layer.
- KPI movement: cycle time, support volume, conversion, reliability. The value layer.
A dashboard that stops at the first layer rewards activity. A dashboard that stops at the second layer rewards output. The dashboard worth building joins all three and answers “was the spend worth it?”
Most AI dashboards being installed across companies right now stop at layer one.
Tokenmaxxing
Business Insider has been reporting on the rise of usage leaderboards. Disney had an AI Adoption Dashboard where one employee reportedly invoked Claude roughly 460,000 times in 9 days. JPMorgan, Disney, and Meta were named in a later story about employees competing for AI leaderboard status, what people are now calling tokenmaxxing.
You can see the appeal. Leaders want to know if the company is adopting the tools. A usage dashboard is easy to build, easy to explain, easy to rank. More tokens means more adoption. More adoption means transformation. It’s a neat story, and that’s why it spreads.
Cristina Cordova made the comparison that lands hardest: ranking engineers by token spend is like ranking marketing teams by who spent the most money. The metric points at activity, not value. Spend can be useful, wasteful, experimental, or an automation loop nobody noticed.
Indeed’s CIO took the opposite path and said they would not use token leaderboards because they create perverse incentives. That’s the right instinct. Measuring usage privately is observability. Ranking usage publicly creates gaming.
Goodhart’s Law explains the gaming half. The other half is that even when nobody is gaming, the usage signal can still be wrong.
Same Burn, Different Causes
Anthropic published an April 23 postmortem about Claude quality degradation. Three bugs spanned March and April: a reasoning-effort downgrade, a thinking-deletion bug, and a verbosity prompt that hurt coding quality.
The bugs passed code reviews, automated tests, and dogfooding. Users had been complaining for weeks that Claude felt lazy, forgot context, and burned more tokens for the same work. Anthropic eventually confirmed the degradation and reset usage limits for subscribers.
The conversation hasn’t ended. Users are still tracking prompt caching behavior and debating whether it inflated burn in ways the official postmortem didn’t cover.
Same user-visible burn can come from very different places: a real task, bad session hygiene, a leaderboard incentive, or a vendor-side regression. Raw usage flattens all of those into the same number.
If you were ranking engineers on token spend during March and April of 2026, you probably weren’t ranking them on adoption. You may have been ranking them on who got hit hardest by these vendor regressions.
Even when the metric isn’t being gamed, it isn’t telling you what you think it’s telling you.
What Better Measurement Looks Like
Artifacts give you a better signal than usage: code merged, PRs accepted, defects fixed, cycle time, and cost per resolved issue.
Anthropic’s own Claude Code ROI guide points in this direction: output, acceptance, PRs, work completed. It doesn’t say “rank people by token burn.” The official guide is already closer to value than the leaderboards are.
I built ccburn at the activity layer because I wanted to know if I was about to run out of Claude Code mid-session.
Burn rate stopped being enough pretty quickly, because some expensive sessions produced clean architecture and some cheap ones produced code I had to throw away. So Claudefana added cache efficiency, cost per commit, and edit accept rate. Claudefana Enterprise added the org context by joining Claude Code usage with team structure and Jira/Tempo work data, answering the questions Anthropic’s ROI guide asks.
But artifacts are still only the middle layer.
I wrote last week about the Super IC, and the core idea was that code is no longer the outcome by itself. Code is the enabler. The deliverable is the measured outcome.
The same applies here. If AI helped you merge more code but conversion didn’t move, support volume didn’t drop, or cycle time didn’t improve, the value question is still open. The dashboard should make that visible. It should help you ask better questions, not hand you a leaderboard and pretend the ranking is the answer.
The Scoreboard Warning
A usage leaderboard is easy to build and feels like progress, but it keeps the real dashboard questions out of view: whether cycle time dropped, defects fell, support tickets eased, or the product shipped faster.
The dashboard worth building connects spend to shipped work, then to the KPI the work was supposed to move.
Keep usage in the observability layer and tie value to outcomes, because once usage becomes the scoreboard, people learn to win the scoreboard.